 Hierarchy Display

Hierarchy Display
You can display the hierarchy of a characteristic in different ways:
Compact display
In compact display, the first column contains symbols which show whether a row can be expanded or collapsed, or whether a row has already been expanded as far as you can expand it. By double-clicking on one of these symbols you can expand an expandable row or collapse a collapsible row.

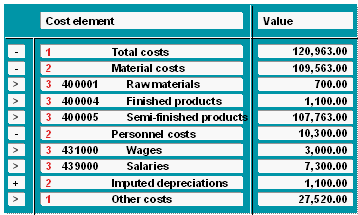
The hierarchy shown above consists of two branches. A branch always begins with the first level. In the above graphic, the first branch contains a total of three levels. Level 2 (material costs) is expanded completely and can be reduced if desired (-). This would mean that the rows that follow, indicated with "Level 3" (raw materials, finished products and semi-finished products) would no longer be visible.
The item "Imputed depreciation" can be broken down further and is therefore displayed with the symbol for "collapsed" (+).
The row "Other costs" is a node at the highest level (Level 1) which cannot be broken down any further. Thus it is also a node at the lowest level and is consequently indicated with a (>).
The lead column (cost element) in compact display contains the hierarchy level in the form of a number. One (1) is always the highest level. The higher the number, the deeper down the characteristic is divided. The lead column also contains the key and/or name of the characteristic value.
Asterisk display
In asterisk display as well, the first column contains symbols indicating whether the rows can be expanded or collapsed, or whether the lowest level has been attained.

Line display
Line display corresponds to the type of display which you find in SAPmail and in many other areas of the R/3 System. Symbols directly located on the nodes indicate whether the level can be expanded or collapsed, or whether the lowest level has been attained.

Line display with blank line
This type of display is the same as normal line display except that a blank line separates rows of different levels. Line display with blank lines is easier to read compared to normal line display, but can also lengthen your report considerably in some cases.
