

 Dialog per Application Server Monitor
Use
You can use the Dialog per Application Server monitor to display the most important attributes for the dialog service, broken down by the application servers of your SAP R/3 System. The attributes are taken from the
Entire System monitor of the SAP CCMS Monitor Templates monitor set.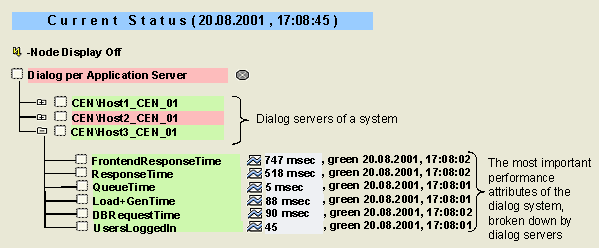
Features
The following table provides information about the monitoring tree elements (MTEs) of this monitor:
|
MTE |
Description |
Additional Information |
|
FrontendResponseTime |
Average time that a user waits at the frontend for the processing of his or her request |
Entire System Monitor |
|
QueueTime |
Average time in the dispatcher wait queue |
|
|
Load+GenTime |
Average load and generation time of CUA objects |
|
|
DBRequestTime |
Average time for processing logical database requests |
|
|
ResponseTime |
Average response time of the dialog service |
Dialog Overview Monitor |
|
UsersLoggedIn |
Users Logged On |
Activities
To start the monitor, follow the procedure below: