Monitoring Selected Processes with SAPOSCOL
Purpose
You can monitor the availability of selected processes with SAPOSCOL. These are displayed in the Monitored Processes subtree of the
 Operating System monitor and in the detailed analysis of the Operating System Monitor. The monitor displays the number of running processes and the CPU and memory usage for each name pattern, broken down by different users.
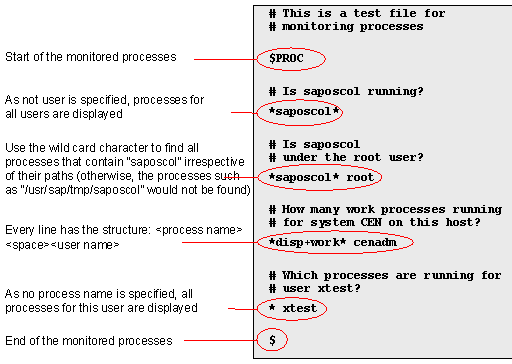
The data is collected using the configuration file
dev_proc and is written to a segment of the shared memory. This is performed in collection intervals of 10 seconds, by default. CCMS agents or, for example, ABAP function modules can read this data from the shared memory and display it in the SAP system.Prerequisites
The data transfer from the remote system is performed using the CCMS agent SAPCCMSR, which must also be installed on the monitored host (see
Installation of the CCMS Agents).
Process Flow
To start monitoring selected processes, follow the procedure below:
Creating the Configuration File
dev_procThe file dev_proc must be in the
working directory of SAPOSCOL. It has the following structure:Restarting SAPOSCOL
SAPOSCOL reads the file
dev_proc when it is started. If SAPOSCOL is already running, you must stop and restart SAPOSCOL so that the changes to the file take effect. You can do this, for example, using the following commands (see the dialog mode of the operating system collector SAPOSCOL):saposcol –d
Collector>kill
Collector>launch
Collector>exit
Setting the Threshold Values
As the expected CPU and memory usage is different for each process, you should adjust the threshold values of the corresponding performance attributes. The simplest way to do this is directly in the Alert Monitor itself, by selecting the relevant performance attribute and choosing Properties (see
Changing Properties and Maintaining Methods). Ensure that you choose Edit ®
Properties ®
Use for individual MTE so that you do not change the threshold values for the other monitored processes.
Result
The data for the monitored processes is displayed both in the Detail Analysis Menu of the operating system monitor and in the Operating System monitor in the subtree Monitored Processes:
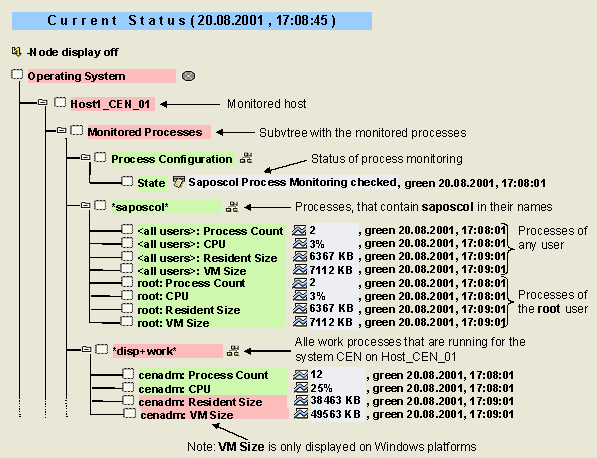
The following table provides information about the monitoring tree elements (MTEs) of this monitor:
|
MTE |
Description |
|
Process Configuration |
Status of the process monitoring; this node exists, even if no processes are being monitored |
|
Process Count |
Number of running processes that fulfill the conditions for process name (superordinate node) and user (prefix of the MTE name) |
|
CPU |
Total of the CPU usage of the above processes, as a percentage |
|
Resident Size |
Total physical memory that is assigned to the above processes |
|
VM Size |
Total of the entire memory (physical and virtual) that is assigned to the above processes (only on Windows platforms) |

After changes in the configuration file
dev_proc, subtrees are created for new monitored processes at the next start of the data collection methods, which run once per minute; processes that are no longer monitored are first set to inactive after around five minutes (you can identify this due to the gray color) and then deleted after another five minutes.Example
Configuration File dev_proc for a UNIX Host