Measurement Overview
Measurement Overview
To open the analysis overview, choose Analyze from the initial screen of the runtime analysis transaction.
Example
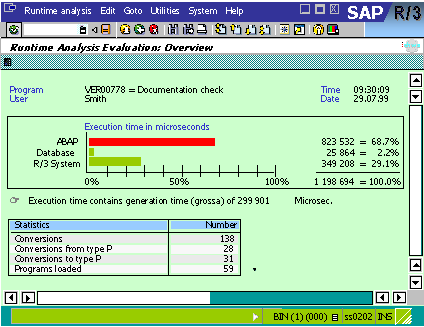
The analysis overview contains general information about the performance of your program. It displays the overall runtime of the program in microseconds, both in figures and as a bar chart, as well as telling you how much memory each particular modularization unit required.
Bar Chart
The bar chart displays the total runtime required for
A green bar indicates that the corresponding statements required less than 50% of the total runtime. A red bar indicates that one of the statement categories required more than 50% of the total runtime.
If the system had to generate a program during the runtime analysis, it reports the fact below the bar diagram. In this case, the total runtime includes the time required for the program generation.
Statistics
The statistics entries at the bottom of the overview screen indicate the frequency of the following operations during the program:
The number of conversions to and from type P is also contained in the overall number of conversions. If you double-click a line in the statistics display, you can display the list of the objects responsible for the action in question.