 Key Figure Schemes
Key Figure Schemes
Use
You can analyze a large number of key figures in your reports in Profitability Analysis. These key figures can be either value fields stored in the database or key figures calculated in a
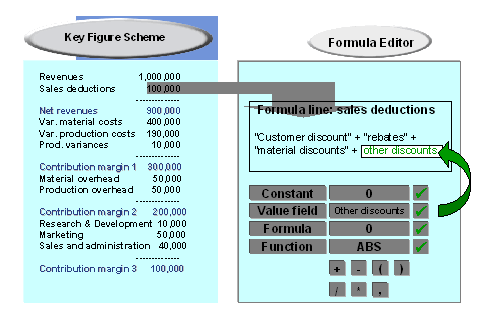
Key Figure Scheme. A key figure scheme is a group of formulas that define a number of key figures.For example, you can display a contribution margin scheme in the key figure scheme by taking the corresponding values and calculating the extra key figures required.
Two functions are available for defining individual key figures:
Structure
The elements can be defined using value fields as well as any other already defined elements of the same key figure scheme. Each element is assigned a unique number, and can also be given a text and special display parameters.

On the Elements in the key figure scheme screen, you can choose ![]() to display an overview list containing all the elements of a key figure scheme and the formulas stored.
to display an overview list containing all the elements of a key figure scheme and the formulas stored.
As with value fields, you can use the elements of the key figure scheme both in forms and in report definitions.
Since key figures are generally defined in several steps, it makes sense to define several related key figures in the same key figure scheme.
It is possible to represent all the key figures you require in the same key figure scheme. However, it makes more sense to create different key figure schemes for different business purposes, as explained in the following example:

You define key figure schemes in CO-PA Customizing under Information System ® Report Components
 Define Key Figure Scheme. When you define a profitability report, you can change an existing key figure scheme or define a new one by choosing Extras ®
Key figure scheme.
Define Key Figure Scheme. When you define a profitability report, you can change an existing key figure scheme or define a new one by choosing Extras ®
Key figure scheme.