Aggregation
Aggregation
You can restrict the runtime measurement to particular objects by choosing Change from the Measurement restrictions group box on the initial screen.
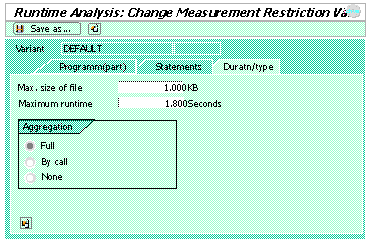
If you choose Duratn/type, the aggregation type is displayed as well as the size of the performance data file and the time limit for the measurement.
Aggregation reduces the number of entries written in the performance data file. There are two types of aggregation: full aggregation and aggregation by call.
You can use aggregation as the first step in your runtime analysis to identify the most time-consuming calls. You can then restrict your second, more detailed analysis to these objects.
 Certain information is not available when you use aggregation. For example, there is no hierarchy. If you use full aggregation, you cannot switch to the call in the source code either. The effect of the display filter is that the events are displayed without their net times being recalculated.
If you intend to repeat the measurement, you can save your entries as a variant by choosing Save as… If you choose Save (