 Key Figures for Breakdown Statistics
Key Figures for Breakdown Statistics
By using the breakdown statistics you can analyze the causes of a particular breakdown more closely. The focus in this case is on the distribution of duration of the various breakdowns or repairs, and on how these were caused. The aim of these analyses is to find out the cause behind a short or long breakdown period, or the period between two consecutive breakdowns. An indicator in the first screen of the notification indicates that a malfunction report or a maintenance request contains a machine breakdown.
Key Figures for Machine Breakdowns
We distinguish between the following:
The reported breakdowns are important from a business point of view, whereas the actual breakdowns are of interest from a technical viewpoint.
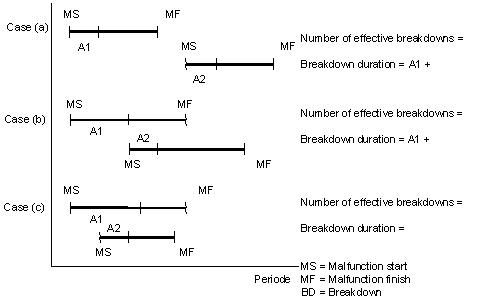
There are three cases which are important for the breakdown analysis. These are represented in the following diagram, which displays two reported breakdowns in each case.
Key Figures for Downtime
The key figures for downtime comprise the following figures:
The average duration of a machine breakdown, MTTR (Mean Time To Repair), is calculated from the individual history of a piece of equipment. This gives us the following formula:
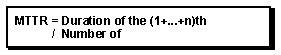
The key figure MTTR is calculated in hours.

First breakdown 10 hours
Second breakdown 05 hours
Number of breakdowns 02
MTTR = 10 + 5 / 2 = 7.5 hours

To calculate the key figure Mean Time To Repair, in the breakdown analysis (information structure S070) the effective breakdowns and the number of effective breakdowns are taken into account. In all other analyses (and the underlying information structures) the noted breakdown duration and the number of noted breakdowns are taken into account.
Key Figures for Duration Between Machine Breakdowns
The key figures for the duration between machine breakdowns comprise the following ratios:
The average duration between two machine breakdowns, MTBR for short (Average Time between Repair), is calculated from the individual history of the equipment. This gives the following formula:

The key figure MTBR is calculated in hours.
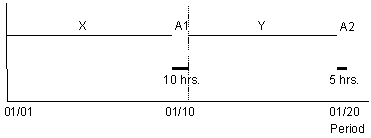
The following example shows how the MTBR is calculated:
Acquisition date of pump A 01/01/94
First breakdown 01/10/94
Downtime 10 hours
Second breakdown 01/20/94
Downtime 5 hours
Number of breakdowns 2
MTBR = (19 * 24 - 10) / 2 or X + Y (St) / 2
= (456 - 10) / 2 or (216 + 240 - 10) / 2
= 223 hours

When calculating the key figure Mean Time between Repair, only the start-up date can be taken into account if the indicator Start-up was set in the master data for equipment or functional locations. If the indicator was not set then the end date of the first malfunction message will be taken into account. In this case, the first malfunction message will not be used when calculating the key figure MTBR (refer to the following illustration).
