
 High
Response Time While Browsing DTR
High
Response Time While Browsing DTR

Problem Description
Browsing the contents of workspaces is very slow, which sometimes results in read a timeout when browsing or synchronizing contents; or very high response times.
|
Scenario Type: |
Performance analysis |
|
NetWeaver Component: |
Design Time Repository (DTR) |
|
Validity: |
DTR version >= 640 SP07 SAP Web AS version > = 640 SP05 |
Decision Roadmap
Prerequisites
-
Main Tools
Microsoft Internet Explorer
SAP NetWeaver Developer Studio
Execution
The following figure gives a graphical overview of the analysis process:
Starting the database manager
● MaxDB (SAPDB)
○ Using a browser:
Connect to http://<m/c name>:9999/webdbm and provide the logon information.
○ Using SAPMMC [Windows platforms only]
Connect to the required SAP Web AS system and launch the management console (start → Programs → SAP Management Console) and select the database node.
● MS SQL Server
Using the Enterprise Manager Connect to the required SAP Web AS System, launch the SQL Server Enterprise Management (start → Programs → Microsoft SQL Server → Enterprise Manager) and select the required server node.
Analysis
1. Database statistics status check
Statistics update for MaxDB
Select Tuning → Optimizer Statistics and then click on the Select button.
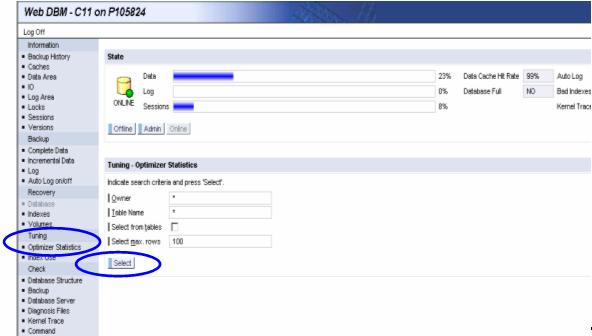
Select all tables that start with the prefix PVC, DAV or IMS.
Deselect the Use Estimate by checkbox and select Execute to update the statistics.
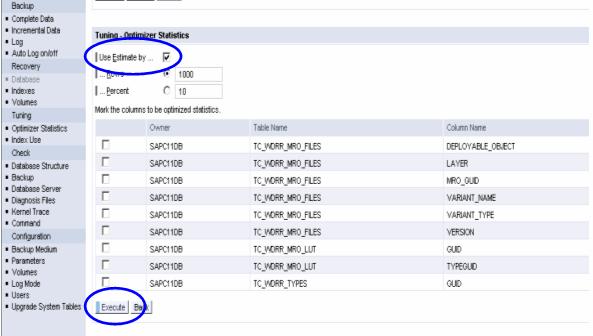
If there are no messages or only a few messages, then proceed with step 2 Database cache settings check.
If the performance still has not improved proceed with step 2.
2. Database cache settings check
You can check the cache settings using the database administrator. To launch the database administrator proceed as described in section MaxDB (SAPDB).
Cache settings update for MaxDB
Select
Configuration → Parameters → CACHE_SIZE. See the help portal documentation
for the minimum recommended value:
 DTR
Database.
DTR
Database.
● If the value is less than the recommended value, you must increase the value according to the recommendation. You need to restart the database to activate the changes.
● If the value is equal or more than the recommended value, you can proceed with step 3. Database log settings check.

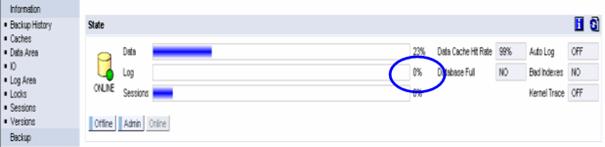
3. Database log settings check
You can check the log settings using the database administrator. To launch the database administrator proceed as described in MaxDB (SAPDB).
Log settings for MaxDB
If the log file is more than 80%, you must increase the log file:
Increasing the log file size
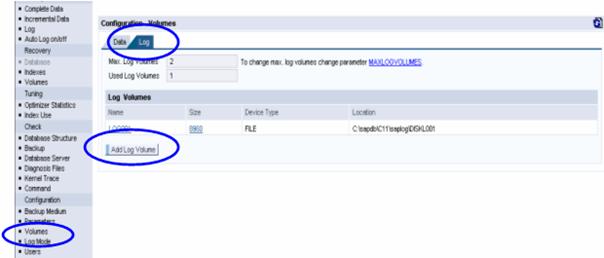
You can increase the log file size by adding another log volume to the existing logs. To add a new log volume, select Configuration → Volumes → Log. Select Add Log Volume.
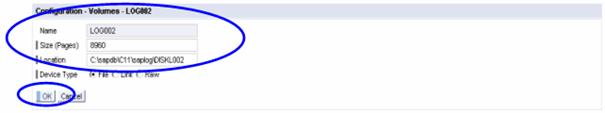
You will see a screen as shown above. Now you must fill in the Size and Location and then select OK for the settings to take effect.
4. Corrupt index check
You can check for corrupt indexes using the database administrator. To launch the database administrator, proceed as described in MaxDB (SAPDB).
Repair corrupt indexes for MaxDB
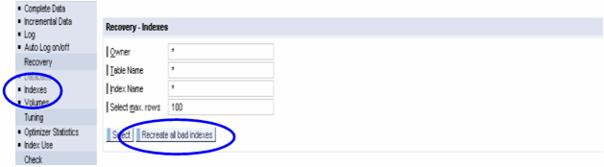
Select Recovery → Indexes. Select Recreate all bad indexes and you may need to restart the database.
If you want to view the list of corrupt indexes, click on Select. This displays the list of all corrupt indexes and you can recreate the necessary indexes.
5. Virtual Memory (VM) on Web AS check
You can check size of the virtual memory allocated for each of the SAP Web AS cluster nodes. To perform the VM check, go to the installation drive of the SAP Web AS.
● On Windows platforms, start <installation_drive>:\usr\sap<system_id>\JC<instance_no>\j2ee\configtool\ configtool.bat
●
On UNIX platforms, start
/usr/sap<system_id>/JC<instance_no>/j2ee/configtool/configtool.sh
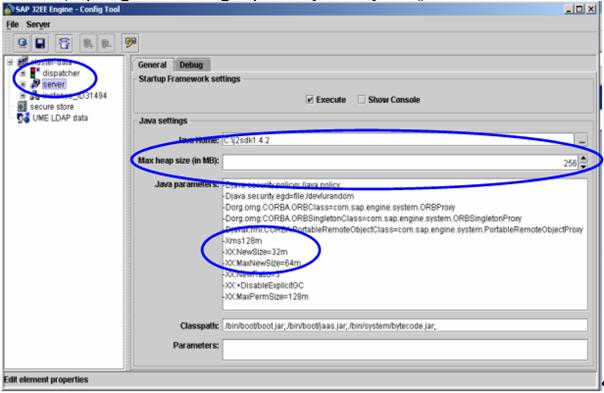
The recommended settings of the Max Heap Size must be checked on the dispatcher as well as each of the server nodes in the cluster. Use the recommendations from Note 723909.
If any changes are necessary, apply the changes by choosing Save and restart all the nodes in the cluster.
Additional Information