
 Code
Example for Displaying a Gantt Chart
Code
Example for Displaying a Gantt Chart

Use
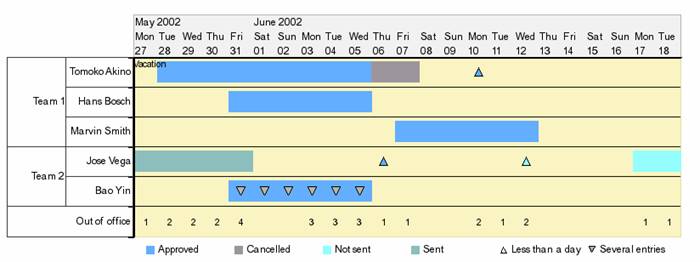
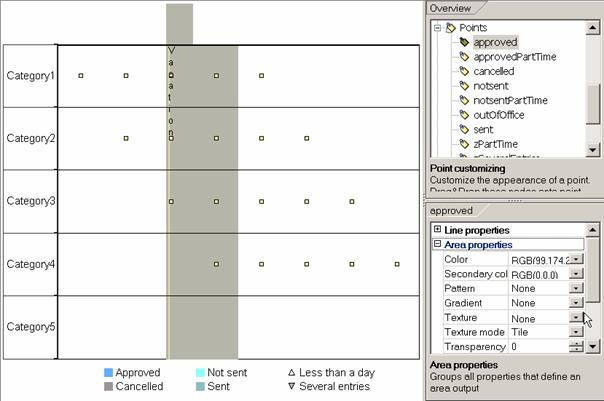
A Gantt chart is a complex chart type that shows one or more actions or activities over a period of time.
The example below shows the following for a Gantt chart, a non-category-based chart type:
● The structure of the Business Graphic UI element with its sub-elements
● The corresponding context structure
● The source code of the controller implementation that fills the context with data. This code can be defined either in the wdDolnit method or in the supply function of the controller implementation
The category-based chart types can contain more complex data series, which are specified using the series and point objects. To display points in a Gantt chart, you need the definition of the start and end values.
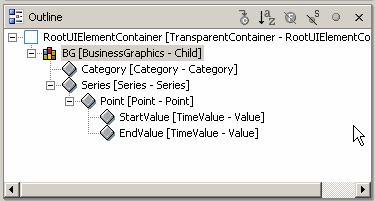
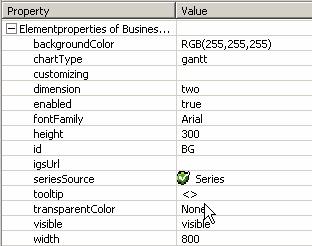
Structure of the BusinessGraphics UI element for a Gantt chart in the “GanttTestView” view (see screenshot of the SAP NetWeaver Developer Studio below):
Procedure
Creating the Layout of View StartView
1. Add BusinessGraphics UI element BG.
2. Add category element Category.
3. Add series element Series.
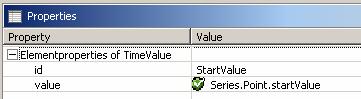
4. Add TimeValue element StartValue.
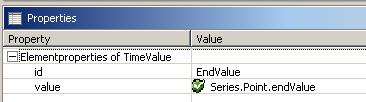
5. Add TimeValue element EndValue
...
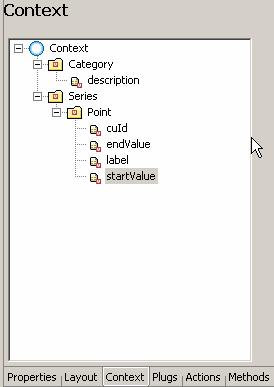
Creating the Context Structure
1. Create context node Category from collection type List (singleton node)
2. Create context attribute description of type String
3. Create context node Series from collection type List (singleton node)
4. Create context node Point from collection type List (non-singleton node)
5. Create context attribute cuId of type String
6. Create context attribute endValue of type String
7. Create context attribute label of type String
8. Create context attribute startValue of type String
Defining Data Binding of the User Interface Element Properties
In general: The
seriesSource property of the BusinessGraphics UI
element is bound to a context node superordinate to all context attributes
that provide all relevant data for the data series.
The pointSource property of the Series element must
be bound to a context node that is the child of the context node to which the
seriesSource property of the BusinessGraphics UI
element is bound. All other bindable point element properties – such as
label and tooltip – must be bound to the context
attributes that are children of the context node to which the valueSource property of the Point element is
bound.
The valueSource property of the Point element is
bound to the same context node as the pointSource property of the Series element. As a
result, each point has the same number of values. The valueproperty of the TimeValue element must be
bound to a context attribute subordinate to the context node to which the
valueSource property of the Point element is
bound.
The seriesSource property of UI element BG is bound to context node Series. |
|
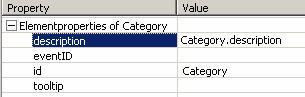
The description property of the Category element is bound to context attribute Category.description. |
|
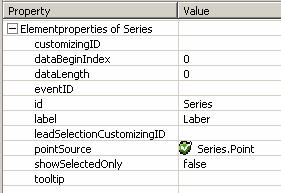
The pointSource property of the Series element is bound to context node Series.Point. |
|
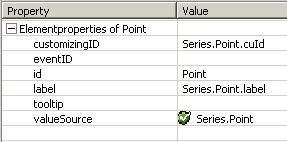
The customzingID property of the Point element is bound to context attribute Series.Point.cuId. The label property of the Point element is bound to context attribute Series.Point.label. The valueSource property of the Point element is bound to context node Series.Point. |
|
The value property of the StartValue element is bound to context attribute Series.Point.startValue.
|
|
The value property of the EndValue element is bound to context attribute Series.Point.EndValue.
|
|
Implementing a Controller
The source text below illustrates how the context is filled with data for the above example at runtime. The required data is supplied in four string arrays, catLabels, pointCustomizing, pointLabels, and timeValues, and written to the context in two loops, seriesIndex and pointIndex.
The first loop writes the category descriptions to the context and sets the description for each category node element. You can group the category descriptions under a superordinate description. To do so, you have to start the descriptions of the subcategories with two backslashes, as illustrated in string array catLabels.
The loops of the series index and point index create the points for a series. Each point is assigned a time segment consisting of a start point and an end point. Each point is also assigned point Customizing and a point label. This is achieved by writing the example data to the context with the loop passes. The time values must have the format YYYYMMDD, where Y is the year, M is the month, D is the day – for example, 20040205. In addition, you can use a semicolon as a separator to specify hours, minutes, seconds, and milliseconds.
The following formats are valid:
· YYYYMMDD
· YYYYMMDD;HHMMSS
· YYYYMMDD;HHMMSSZZZ (H=hours, M=minutes, S=seconds, Z=milliseconds).
In general, this format refers to all graphics with time lines, such as TimeScale graphic.
To give the presentation graphics the appearance shown in the screenshot under Use, you have to define Customizing for the individual points. To do so, call the Chart Designer from the context menu and define the point Customizing for the values listed in string array pointCustomizing in the overview of graphical elements.
You also have to define the legend of the Gantt chart in the Chart Designer, using the Caption property under node Advanced.
//@@begin javadoc:wdDoInit() /** Hook method called to initialize controller. */ //@@end public void wdDoInit() { //@@begin wdDoInit()
String[] catLabels = {
"Team 1",
"\\1Tomoko Akino", "\\1Hans Bosch", "\\1Marvin
Smith",
String[][] pointCustomizing = { { "approved", "cancelled", "approvedPartTime" }, { "approved" }, { "approved" }, { "sent", "approvedPartTime", "notsentPartTime", "notsent"}, { "approved", "zSeveralEntries", "zSeveralEntries", "zSeveralEntries", "zSeveralEntries", "zSeveralEntries", "zSeveralEntries" }, { "outOfOffice", "outOfOffice", "outOfOffice", "outOfOffice", "outOfOffice", "outOfOffice", "outOfOffice", "outOfOffice", "outOfOffice", "outOfOffice", "outOfOffice", "outOfOffice", "outOfOffice", "outOfOffice", "outOfOffice" } };
String[][] pointLabels = { { " ", " ", " " }, { " " }, { " " }, { " ", " ", " ", " "}, { " ", " ", " ", " ", " ", " ", " " }, { "1", "2", "2", "2", "4", "3", "3", "3", "1", "1", "2", "1", "2", "1", "1" } };
String[][][] timeValues = { { { "20020528", "20020606" }, { "20020606", "20020608" }, { "20020610", "20020611" } }, { { "20020531", "20020606" } }, { { "20020607", "20020613" } }, { { "20020527", "20020601" }, { "20020606", "20020607" }, { "20020612", "20020613" }, { "20020617", "20020619"} }, { { "20020531", "20020606" }, { "20020531", "20020601" }, { "20020601", "20020602" }, { "20020602", "20020603" }, { "20020603", "20020604" }, { "20020604", "20020605" }, { "20020605", "20020606" } }, { { "20020527", "20020528" }, { "20020528", "20020529" }, { "20020529", "20020530" }, { "20020530", "20020531" }, { "20020531", "20020601" }, { "20020603", "20020604" }, { "20020604", "20020605" }, { "20020605", "20020606" }, { "20020606", "20020607" }, { "20020607", "20020608" }, { "20020610", "20020611" }, { "20020611", "20020612" }, { "20020612", "20020613" }, { "20020617", "20020618" }, { "20020618", "20020619" }} };
IPrivateGanttTestView.ICategoryNode catNode = wdContext.nodeCategory(); for (int catIndex = 0; catIndex < catLabels.length; ++catIndex) { IPrivateGanttTestView.ICategoryElement catElement = catNode.createCategoryElement(); catNode.addElement(catElement); catElement.setDescription(catLabels[catIndex]); }
// loop over series IPrivateGanttTestView.ISeriesNode seriesNode = wdContext.nodeSeries(); for (int seriesIndex = 0; seriesIndex < timeValues.length; ++seriesIndex) { IPrivateGanttTestView.ISeriesElement seriesElement = seriesNode.createSeriesElement(); seriesNode.addElement(seriesElement);
// set series attributes (...) IPrivateGanttTestView.IPointNode pointNode = seriesElement.nodePoint();
// loop over points for (int pointIndex
= 0; pointIndex <
timeValues[seriesIndex].length; { IPrivateGanttTestView.IPointElement pointElement = pointNode.createPointElement(); pointNode.addElement(pointElement);
pointElement.setStartValue(timeValues[seriesIndex][pointIndex][0]); pointElement.setEndValue(timeValues[seriesIndex][pointIndex][1]); pointElement.setCuId(pointCustomizing[seriesIndex][pointIndex]); pointElement.setLabel(pointLabels[seriesIndex][pointIndex]); } } //@@end }
|
Result
You have created a Gantt chart. Before you can call the Web Dynpro application for testing, however, you must build the Web Dynpro project and install the Web Dynpro application on the SAP J2EE Engine.
You start the Web Dynpro applications by choosing Deploy new archive and run in the context menu of the corresponding Web Dynpro application. The Web Dynpro application is called in the browser from a Web address and the Gantt chart appears.