
 Message Failed on the Adapter Engine

Problem Description
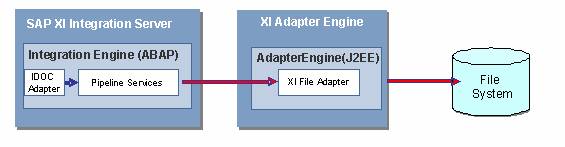
An XML message is successfully sent from the XI Integration Server (IS) to an XI Adapter Engine (AE). The delivery semantic is exactly once (EO). The payload of the message could be an IDoc or any other payload. The problem occurs on the Adapter Engine, which means that the message was successfully delivered from IS point of view. The XML Message Monitor shows the processed successfully flag, as shown below.

Monitor for processed XML messages
When the XML message has successfully arrived at the Adapter Framework, the messaging system processes the message and passes it to the file adapter. The file adapter writes the XML message to the file system, as shown below.
Example Scenario
|
Scenario Type: |
Error analysis |
|
NetWeaver Component: |
XI 3.0 |
|
Validity: |
≥ XI 3.0, SP4 (FP) |
Decision Roadmap
Prerequisites
Main Tools
Visual Administrator
Message Display Tool (MDT)
Basics
If the XML message was successfully delivered to the Adapter Engine, it can be monitored with the Message Display Tool (MDT). This can either be started directly via the URL http://<Host>:<PORT>/mdt/index.jsp or from the Runtime Workbench.
The Adapter Engine’s Messaging System (MS) receives the message, processes it and forwards it to the receiver (that is, the file adapter). While the MS processes the message, it passes several statuses:
● TO_BE_DELIVERED:
The state of message when it is initially handed over to the Messaging System.
● DELIVERING:
The state of message when it has popped out of the MS queuing system and is in the process of being transmitted across the wire or delivered to an application.
● DELIVERED:
The state of message when it has successfully reached its intended recipient.
● HOLDING:
The state of an EOIO message that cannot be delivered until its predecessors have been delivered.
● NON_DELIVERED:
The state assigned to a message when all attempts (retries) to deliver the message to its recipient have failed.
● FAILED:
The state assigned to a message when an administrator decides to abort sending the message, or when a message could not be delivered due to a fatal exception that cannot be repaired.
● WAITING:
The state of a message that has been attempted to be sent at least once, failed, and is currently waiting for another attempt.
In this scenario you should see only the statuses WAITING, DELIVERING, NON_DELIVERED or DELIVERED. Statuses such as HOLDING or FAILED usually happen only for delivery semantics EOIO (exactly once in order) or BE (best effort). TO_BE_DELIVERED occurs while the message is put into the Messaging System receive queue. This is done via the Messaging System receive servlet:
http://<Host>:<PORT>/MessagingSystem/receive/<CONNECTION>/<PROTOCOL>
The MS returns HTTP 200 to the Integration Server only if this was executed successfully. In this example scenario, status TO_BE_DELIVERED should not appear since we assume that the IS has called the servlet successfully.

The status is updated from TO_BE_DELIVERED to DELIVERING when the message has popped out of the receive queue and the event handler lookup was successful, so there is a small gap where TO_BE_DELIVERED could remain in the message monitor, although it was delivered from IS successfully, however, this is out of scope here.
The other four statuses appear in the following order:
● Message status DELIVERING
When the message pops out of the MS queuing system and the lookup of the event handler was successful, it gets the status DELIVERING. This status is kept while the message is transmitted across the wire or delivered to an application. Usually this is a small time period and you should not see it. In cases where an HTTP response takes a long time, for example, this status could be visible.
● Message status WAITING
When the fist attempt to deliver the message has failed (a recoverable exception arose), the message is usually rescheduled and the status is updated to WAITING. As long as the message is in this status, the MS retries to deliver the message according to the configured retry settings (default 3 retries).
● Message status NON_DELIVERED
If all retries were unsuccessful, the message gets this status. From this status it is possible to restart message processing.
● Message status DELIVERED
This is the final status if the message has been delivered successfully.
Analysis
The Message Display Tool is the central tool for monitoring XML messages on the Adapter Engine. As explained above it can be started directly by an URL or via the Runtime Workbench.

Message Display Tool
It shows all messages that have been processed on the Adapter Engine. With the extended filter criteria you can select for asynchronous inbound messages from a special partner, for example, for a time interval or for a message ID. As explained above, messages in error situations have the status NON_DELIVERED.
In error situations perform the following steps:
...
1. Read the message details, which are also called the Audit Log, from the Message Display Tool. The audit log contains information about the executed processing steps in the Adapter Engine. Often it shows details about the error. You can also access the XML message down to its message bytes and check if all partners and so on are set as expected. The figure below shows an example.

Message Details (Audit Log)
2. If you do not find information about the error in the XML message audit log, check the application log file. This log file is accessed with the Visual Administrator’s LogViewer service. Browse to the server node and open the file .\log\applications.log. The application log contains information for system administrators. Try to find an error message using the time stamp of the message or the message ID. An example is shown below. Error messages are colored in red. Sometimes it is useful to customize the columns that are displayed.

Log Viewer
3. If you do not find an error in the log file or the error message does not explain the problem sufficiently, access the defaultTrace. The default trace file contains detailed messages for developers. Try to find more detailed information of the error. Extract the relevant trace information, for example using the time stamp or the message ID.

If there are several cluster nodes, you have to search in the trace files of all servers (for example, if you are searching for a message ID). The default trace is written cyclically. The old trace files are zipped and copied to the server’s archive folder (./log/archive). Therefore, trace information can be found there if the problem occurred in the past. This is done for all server nodes.
4. If this does not explain the problem in more detail, increase the trace level and reproduce the problem. Go to the Visual Administrator’s Log Configurator service and increase the severity of the location com.sap.aii.af.ra.ms to DEBUG. Propagate the severity to the subtree and save your settings. Increase the severity also for other locations according to your scenario, such as com.sap.aii.adapter.file if the file adapter is involved. If you are not sure which components are involved, increase the severity of the XI parent location com.sap.aii. Then restart message processing using the message display tool. Mark the message and select repeat (see the figure below).

Log Configurator

Restart Message Processing
After that you should find detailed error and debug messages. Access the trace file and search for traces with severity ERROR, WARNING or stack traces. Use the Log Viewer’s search function. Pay attention to the correct value in the in column box when you search.
Do not forget to reset the severity to ERROR again. Use the parent location com.sap.aii again and copy the ERROR severity to the subtree. Save the setting. A DEBUG trace level can slow the system down.
Additional Information
 Adapter
Engine
Adapter
Engine