Controlling View
The controlling view displays statistical key figures for a given period such as the number of replenishments, sum of transport times, or average replenishment lead time.
You access the controlling view from the master data view. You select the Kanban materials that you want to see and press the button Controlling.

The controlling view displays numerous historical as well as current key figures. By default, these key figures are aggregated by control cycle. The user can quickly change the aggregation object by directly clicking on the corresponding button. The following aggregation objects are provided: Control Cycle, Plant, Supply Area, Storage Location, Material and person Responsible. Aggregation is particularly meaningful in case of quantity figures. For instance, you can determine the current stock quantity at certain production supply areas or the entire plant.
Key figures are:
-
Number of Replenishments (In-house Productions, Extrenal Procurements,...)
-
Number of Status Messages (Replenishment Operations, Errors,...)
-
Total, Average and Actual Times of Status Messages (Replenishment Time, In Transit Time, ...)
-
Quantity Control (Total Stock, Total Actual Quantity, ...)
-
Current Container Statuses (Empty, Full, ...)
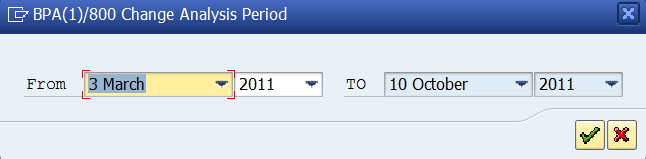
The analysis period is by default six months in the past as of today’s date. If you want to change it, press the period button and enter your data in the dialogue box.
Further you can change the period pattern between overall and monthly. If overall is selected, the statistical data is aggregated over the whole period length. If monthly is selected, the data is aggregated per each month within the period length.
The controlling view of the Kanban monitor measures performance times on an hourly basis and therefore delivers accurate results which ensures efficient controlling of Kanban performance.