Analyze Log
The log documents a test. Errors are highlighted in color.
The log appears automatically after a test. To display logs of previous tests:
- Go to the test case editor.
- Choose
 Utilities
  Display log(s)
  .
. - Complete the following selection screen and choose
 .A list of all test logs which
satisfy the selection criteria is displayed. If there is only one log, the list
is skipped. Continue at 5.
.A list of all test logs which
satisfy the selection criteria is displayed. If there is only one log, the list
is skipped. Continue at 5. - Choose a log by double-click.The log is displayed.
- Analyze the log.
- Leave the log with
 .
.
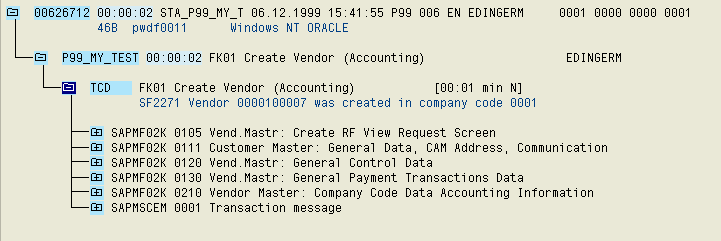
Tests are logged. The log is hierarchically structured according to the test case used, and displayed as a structure with nodes.
The test case is displayed on the first level of the log. The transactions called, the screens used and the entries, outputs and checks in these screens are listed below. Errors are displayed with their messages.
Logs with no Errors
Logs with Transaction Errors
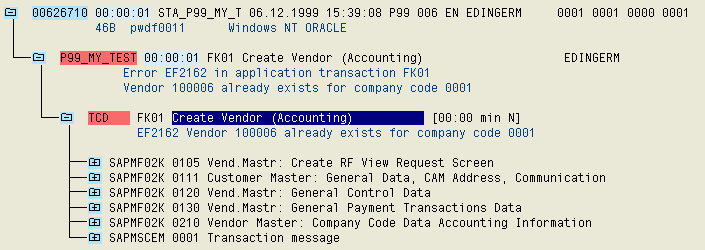
Errors are marked red. If the test case contains several transactions, only those with errors are marked red.
Log with Positive Field Checks
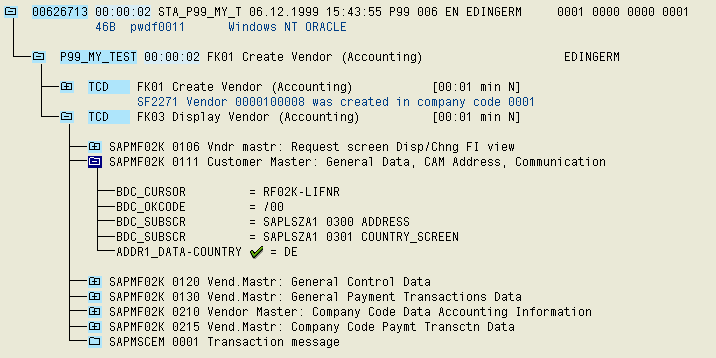
A successful check is indicated in the log by the color green and the  icon. The field
value is displayed in the log.
icon. The field
value is displayed in the log.
Logs with Target/Actual Comparison Errors
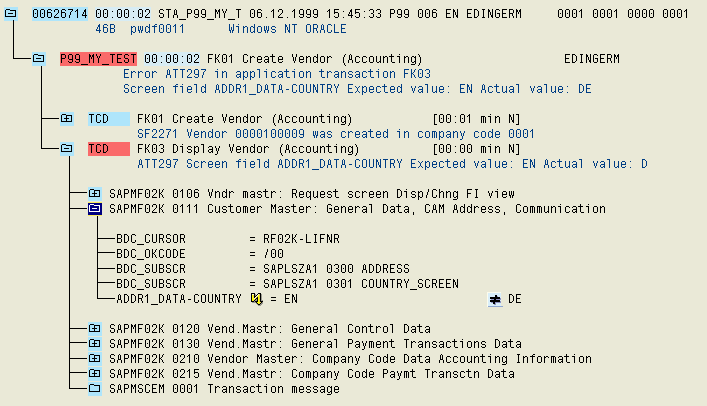
The error is indicated by the color yellow and the  icon. The target and actual values are
logged in that order.
icon. The target and actual values are
logged in that order.
Logs with Actual Value Read Errors
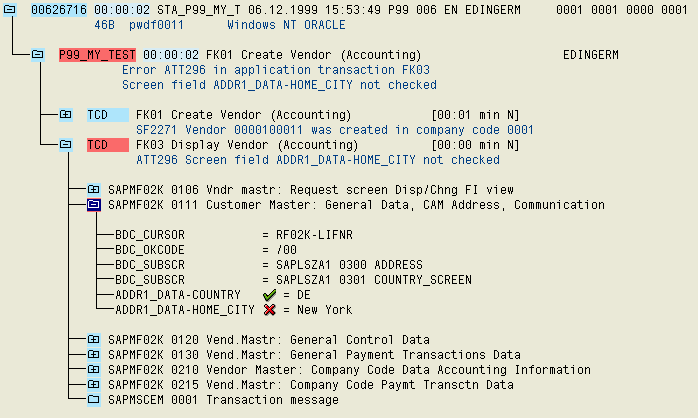
The error is indicated by the color red and the  icon. Only the target value is
logged.
icon. Only the target value is
logged.
Marking processed screens
The screens which were processed during a test are shown In the CATT test plan log: They are displayed in black, screens not processed are in blue. This shows how far a test ran before an error occurred. You can also see any gaps in the screen sequence.
You go to a screen like:

Blue/gray screens were not processed in the test.
This new function is particularly useful for error messages such as Data for screen XX not found .